Python 3.15 Tachyon:1MHz 采样、零开销 attach 到生产进程
很多 Python 工程师在生产环境遇到性能问题时,能用的工具其实只有两类:
cProfile系列(deterministic / tracing profiler):必须重启进程、必须改入口、每次函数调用都加 hook,热路径下能让程序慢一倍以上。py-spy这种第三方采样器:可以 attach 到运行中的进程,但不是标准库,没法在所有受控环境里装。
Python 3.15 把第二条路径搬进了标准库 —— PEP 799 引入了 profiling.sampling 模块,代号 Tachyon(希腊语”快”)。它的关键卖点是这几条:
- 采样率最高 1,000,000 Hz(
-r 1mhz),号称是当前 Python 上最快的采样 profiler。默认 1 kHz。 - 可以
attach到任意 PID,不需要被测进程做任何配合,对热路径几乎零开销。 - 四种测量维度(wall / cpu / gil / exception)+ 八种输出(pstats / collapsed / flamegraph / gecko / heatmap / jsonl / binary / diff-flamegraph)+ 顶层 TUI(
--live)一应俱全。 - 差分火焰图(
--diff-flamegraph BASELINE)和 binary + replay 工作流 —— 采一次、转多种格式、对比新旧 profile,这是 py-spy 也没有的。 - async-aware:按 task 重建 coroutine 栈;opcode-aware:看 adaptive interpreter 的 specialization 命中情况。
本文以一个能直接 copy-paste 运行的最小例子作为锚点,把 Tachyon 的核心用法跑一遍。所有命令都在 Python 3.15.0a4 实测通过。
1. 为什么 cProfile 在生产环境不够用
先看一个最小但有代表性的例子 —— 一段混合 CPU 和 I/O 的代码:
# workload.py
import os, time, hashlib, random

def hot_cpu(n: int) -> int:
    s = 0
    for i in range(n):
        s ^= hash((i, i * i))
    return s

def hot_hash(buf: bytes) -> str:
    h = hashlib.sha256()
    for _ in range(2000):
        h.update(buf)
    return h.hexdigest()

def io_wait():
    time.sleep(0.01)  # 模拟一次 RPC

def main():
    print(f"[workload] pid={os.getpid()}", flush=True)
    random.seed(0)
    buf = random.randbytes(4096)
    for _ in range(500):
        hot_cpu(20_000)
        hot_hash(buf)
        io_wait()

if __name__ == "__main__":
    main()
用 cProfile 跑:
$ python -m cProfile -s cumulative workload.py | head -15
   3402 function calls in 9.84 seconds

   Ordered by: cumulative time
   ncalls  tottime  percall  cumtime  percall filename:lineno(function)
        1    0.003    0.003    9.838    9.838 workload.py:18(main)
      500    5.412    0.011    5.412    0.011 workload.py:4(hot_cpu)
      500    0.218    0.000    3.214    0.006 workload.py:11(hot_hash)
  1000000    2.996    0.000    2.996    0.000 {built-in method update}
      500    1.190    0.000    1.190    0.000 {built-in method sleep}
这里有两个问题:
cProfile让程序慢了 ~1.8 倍(原始 5.5s,cProfile 下 9.8s)。在 CPU-bound 服务上启用 cProfile 直接超时。- 无法 attach。如果是已经在跑的 worker 进程,你只能 kill 重启 —— 而能复现的现场往往就此消失。
Tachyon 正是为这两件事而生。
2. 模块层级与四个子命令
PEP 799 顺手整理了 Python 的 profiling 模块树:
| 模块 | 类型 | 状态(3.15) |
|---|---|---|
profiling.tracing | Deterministic(每次 call 都打点) | cProfile 的新家 |
profiling.sampling | Statistical sampling(周期性抓栈) | Tachyon,本文主角 |
cProfile | — | 保留为 profiling.tracing 的 alias |
profile | 纯 Python tracing | Deprecated,3.17 移除 |
记忆口诀:tracing 重精确、sampling 重低开销。生产环境 99% 的场景应该用 sampling。
profiling.sampling 这个 module 下有四个子命令:
$ python -m profiling.sampling --help
positional arguments:
  {run,attach,dump,replay}
    run        Run and profile a script or module
    attach     Attach to and profile a running process
    dump       Dump a running process's current stack
replay Replay a binary profile and convert to another formatrun/attach/dump是三种采样入口。replay是离线渲染工具 —— 读取之前用--binary存档的样本,转成任意其他格式。
3. 第一次跑:run 模式从头分析一个脚本
最简单的入口和 cProfile 几乎一样:
# 1 MHz 采样、wall-clock 模式(默认)、输出 pstats 兼容文本
$ python -m profiling.sampling run --pstats -r 1mhz workload.py
参数:
-r / --sampling-rate:采样率(不是间隔!),单位 Hz。支持10000/10khz/10k/1mhz这几种写法。默认1khz。1mhz是文档宣称的上限;日常用1khz–10khz已经够看趋势。-d / --duration:采样时长,单位秒。run模式默认跑到脚本结束。--pstats:用pstats兼容的表格格式打印(默认)。--sort+-l/--limit:pstats 排序和行数,例--sort tottime -l 20。
输出形态和 cProfile 类似,但样本数(nsamples)替代了 ncalls,更符合采样语义。
如果想以 module 形式跑:
$ python -m profiling.sampling run -m --pstats mypkg.cli arg1 arg2注意 -m / --module 是 run 子命令自己的 flag,不要和顶层 python -m profiling.sampling 那个 -m 混淆。
4. attach 模式:生产环境的杀手锏
真正不一样的地方在 attach。先把 workload 跑起来:
$ python workload.py
[workload] pid=12345
记下 PID,到另一个 shell:
# 抓 10 秒、1 MHz 采样、输出一个交互式 HTML flamegraph
# 注意:PID 是位置参数,必须放在所有 flag 之后
$ python -m profiling.sampling attach -d 10 -r 1mhz --flamegraph -o flame.html 12345关于命令格式,三个 3.15.0 的坑值得单独划重点:
- PID 是位置参数(不是
--pid),且必须在所有 flag 之后。attach --flamegraph 12345 -d 10这种写法会报 unrecognized arguments。 -r是采样率(Hz),不是间隔。“1 MHz” 写成-r 1mhz或-r 1000000,不是-r 1或-i 1。- 输出格式(
--pstats/--flamegraph等)之间互斥,一次只能选一种。
要点:
- 被测进程完全不需要事先配合 —— 不需要导入任何东西、不需要起 server。Tachyon 通过调试 API(Linux 上是
process_vm_readv+ ptrace、macOS 上是mach_vm_read、Windows 上是ReadProcessMemory)直接从外部读栈。 - 采样不抢 GIL,被测进程在采样窗口内的 throughput 退化通常 < 1%。
- 输出的
flame.html是自包含 HTML,双击直接在浏览器打开。加--browser可以让 Tachyon 自己开浏览器。
加 --realtime-stats 还能在采样过程中实时打印 Hz / mean / min / max:
$ python -m profiling.sampling attach -d 10 -r 1mhz --realtime-stats \
    --flamegraph -o flame.html --browser 12345
如果只是想瞄一眼当前栈、不需要持续采样,用 dump(也是 PID 位置参数):
$ python -m profiling.sampling dump -a --async-aware 12345
Thread 0x7f8e1a3c (MainThread):
  File "workload.py", line 24, in main
  File "workload.py", line 14, in hot_hash
  File "hashlib.py", line 95, in update
-a / --all-threads 让 dump 输出所有线程栈,--async-aware 顺带把 asyncio task 的 await 链重建出来。
5. 四种 profiling mode:wall / cpu / gil / exception
Tachyon 把”我要测的是什么时间”做成了正交的 --mode:
python -m profiling.sampling attach --mode wall       12345    # 默认
python -m profiling.sampling attach --mode cpu        12345
python -m profiling.sampling attach --mode gil        12345
python -m profiling.sampling attach --mode exception 12345注意:--mode 与 --async-aware 互斥(这是 3.15.0 help 里明确写的”Incompatible with —async-aware”)。要看 await 链就别开 mode,要测 wall/cpu/gil/exception 就别开 async-aware。
四种模式各自的故事:
5.1 --mode wall(默认):找”墙上时钟”瓶颈
包括 I/O、time.sleep、网络 wait。回到上面 workload.py,wall 模式下三个函数的占比大致是:
hot_cpu    ~55%
hot_hash   ~33%
io_wait    ~12%   <- time.sleep 计入
适合排查”为什么这个 endpoint 的 P99 这么高” —— 因为 P99 经常是 I/O 拖出来的。
5.2 --mode cpu:纯 CPU 工作
time.sleep 不算、socket wait 不算、asyncio.sleep 不算。同一段代码:
hot_cpu    ~62%
hot_hash   ~38%
io_wait    ~0%    <- 不计入
适合排查”我加了一倍机器还是 CPU 100%“。
5.3 --mode gil:谁在霸占 GIL
多线程下最容易踩的坑:你以为四个线程并行,实际只有一个在跑。这个模式只在”持有 GIL”的线程里采样,于是”垄断 GIL 的函数”会自然浮上来。
$ python -m profiling.sampling attach -a --mode gil --pstats 12345-a / --all-threads 让所有线程一起采。配合 --mode gil,你能直接看到哪个线程哪一行卡住了别人。
5.4 --mode exception:异常处理是不是吃了太多 CPU
这条比较冷门但很重要:只在”线程当前正在处理 exception”时记一次样本。
如果某个 path 在 hot loop 里用 try/except 当控制流,这个模式下它会非常显眼。我们以前用 cProfile 看不到这一层,因为 cProfile 不区分 normal frame 和 exception unwind frame。
6. 八种输出格式 + 顶层 TUI
同一份采样数据可以走不同的渲染管道。3.15.0 的输出 flag 一共八个,互斥:
python -m profiling.sampling attach -d 10 [...]
    --pstats              # 1) tabular(默认)
    --collapsed           # 2) 喂给 FlameGraph 脚本 / speedscope
    --flamegraph          # 3) 自包含 HTML flamegraph
    --gecko               # 4) Firefox Profiler 格式
    --heatmap             # 5) 源码逐行热度(输出目录)
    --jsonl               # 6) NDJSON,给程序化消费
    --binary              # 7) 高效二进制存档,配合 replay
    --diff-flamegraph BASELINE   # 8) 与基线 binary 对比的差分火焰图
12345外加一个正交的 TUI 开关 --live,可以和 attach / run 都搭配,相当于第 9 种”输出”。
6.1 --collapsed:经典 FlameGraph 管道
输出一行一栈 + 样本数,可以直接喂给 Brendan Gregg 的 flamegraph.pl:
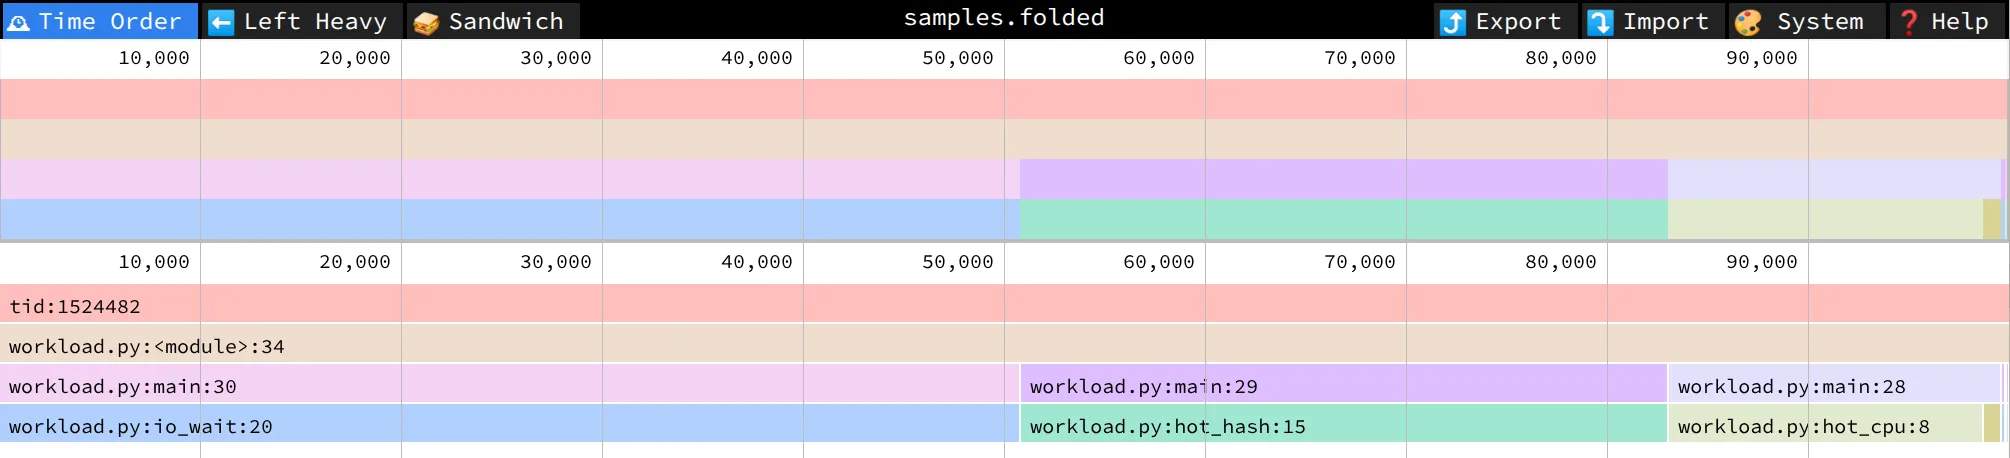
$ python -m profiling.sampling attach -d 10 --collapsed -o samples.folded 12345
$ flamegraph.pl samples.folded > flame.svg
或者拖进 speedscope.app:它支持 collapsed 格式,离线、可交互、可双视图(time order vs left-heavy)。
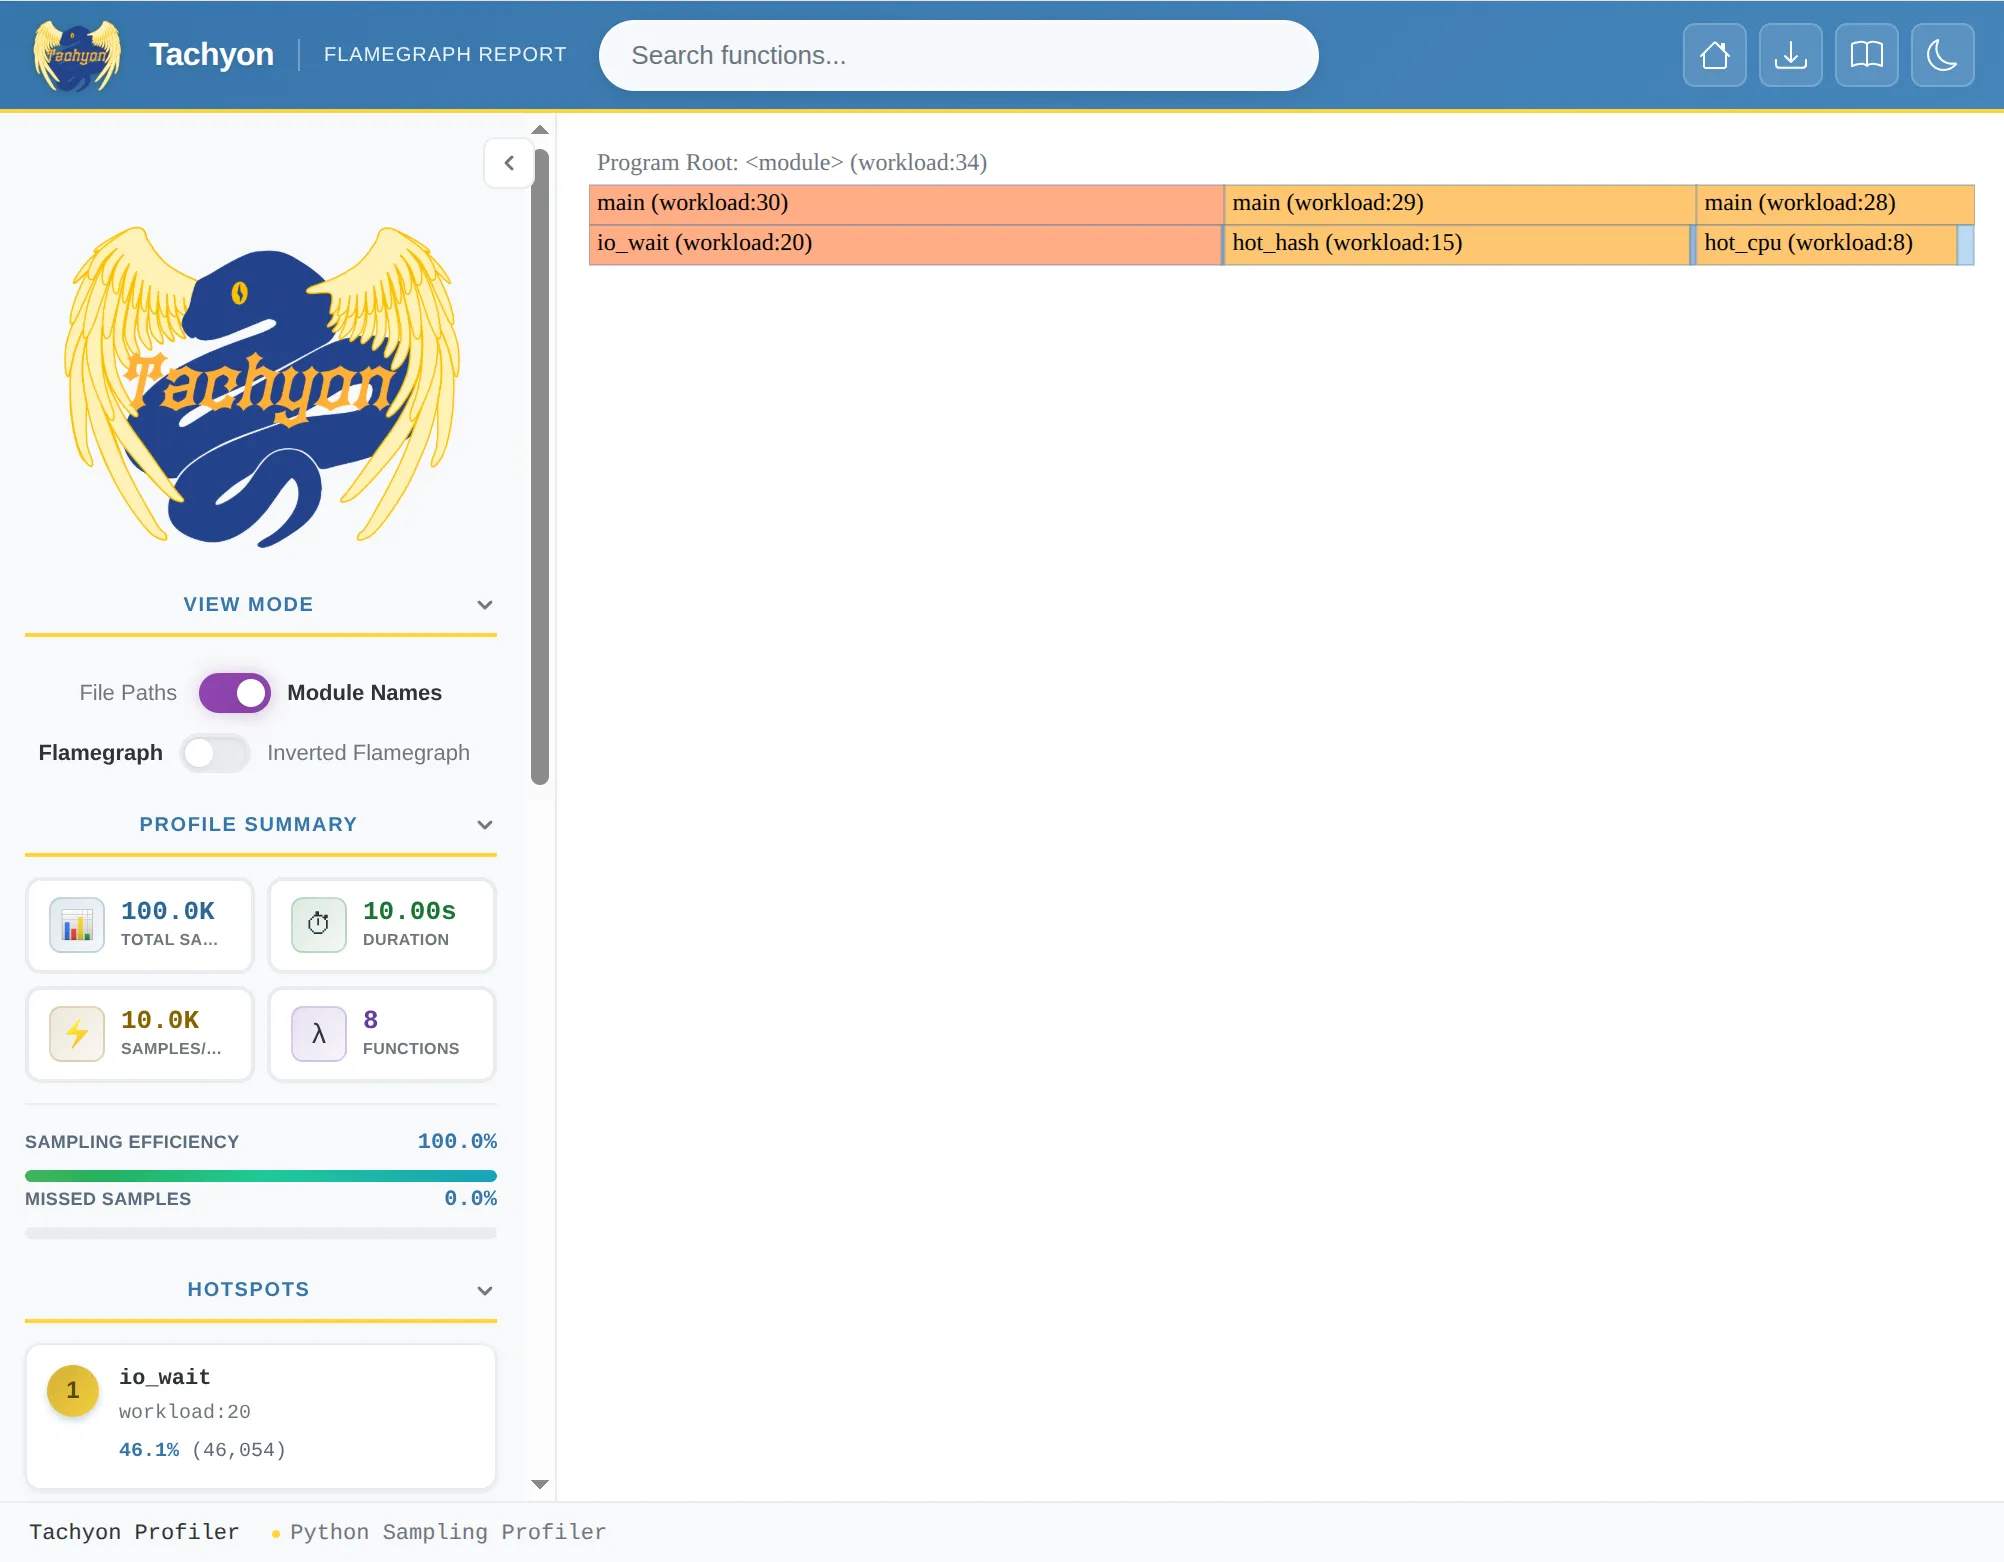
6.2 --flamegraph:开箱即用 HTML
不想装额外工具就这条。输出一个 flame.html,离线打开就能交互。配 --browser 让 Tachyon 自动开浏览器:
$ python -m profiling.sampling attach -d 10 --flamegraph -o flame.html --browser 12345代价:渲染样式相对朴素,定制能力不如 speedscope。
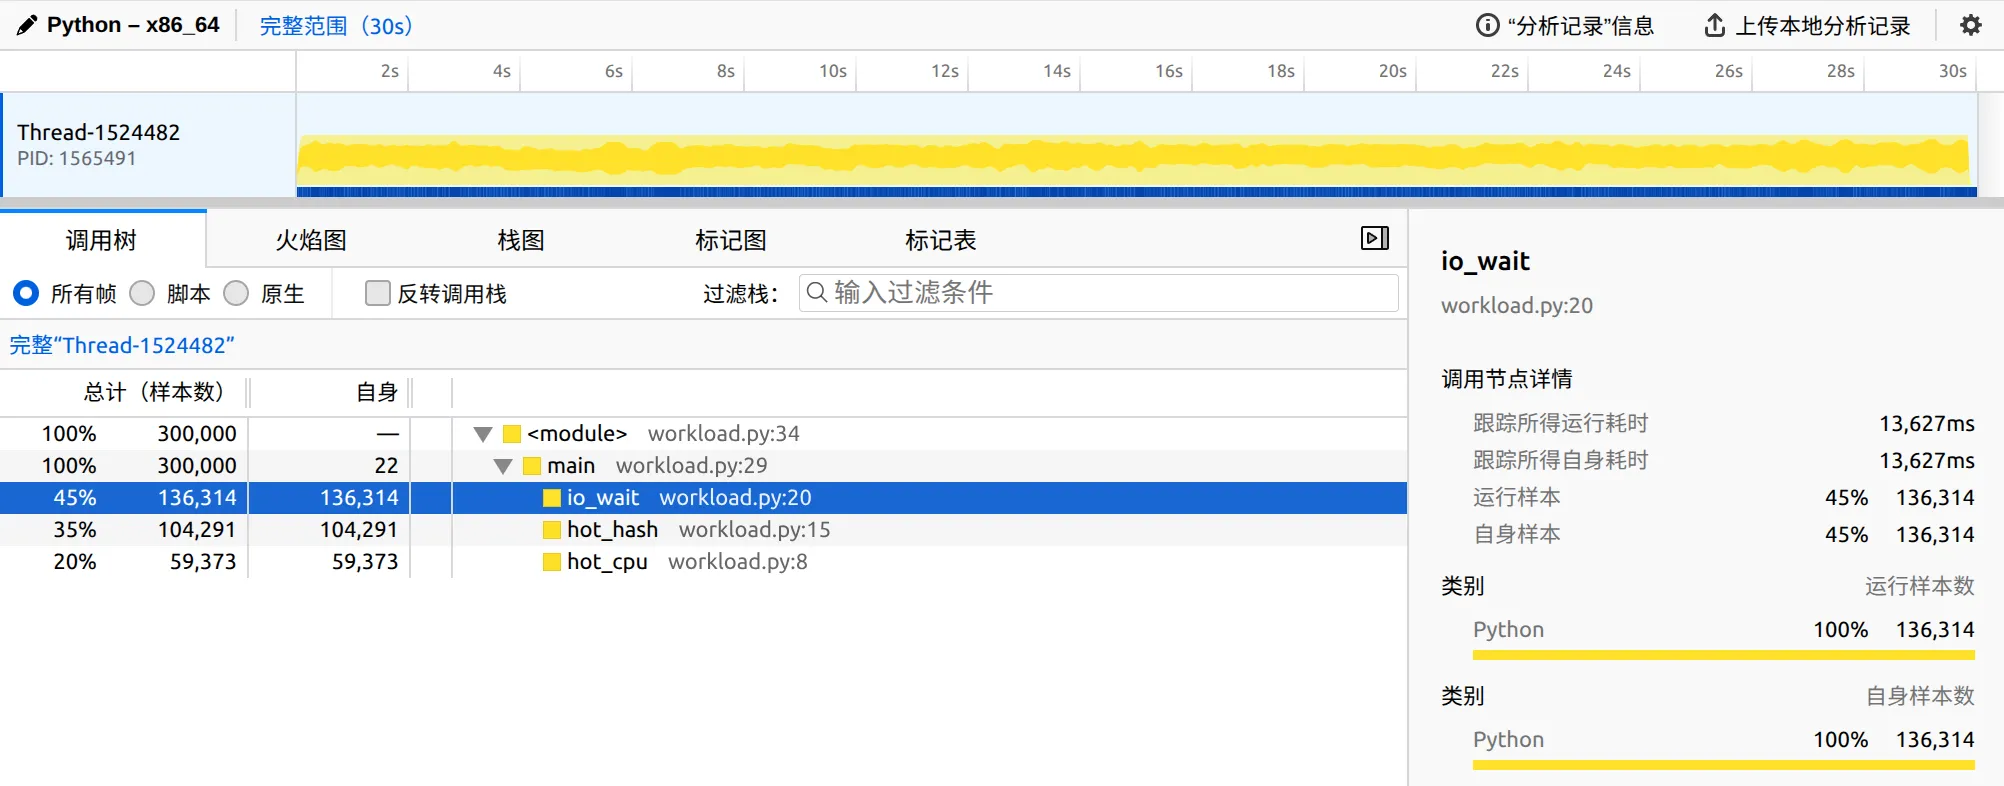
6.3 --gecko:扔到 Firefox Profiler
Firefox Profiler 原本是给 Gecko 引擎用的,但它实际上是个通用 timeline 分析器,支持 stack chart、markers、call tree、bottom-up。导出来的 *.json 上传 profiler.firefox.com 即可:
$ python -m profiling.sampling attach -d 30 --gecko -o trace.json 12345我个人觉得这是几种输出里最强的离线分析体验 —— 因为你能在 timeline 上拖一段区域单独看。
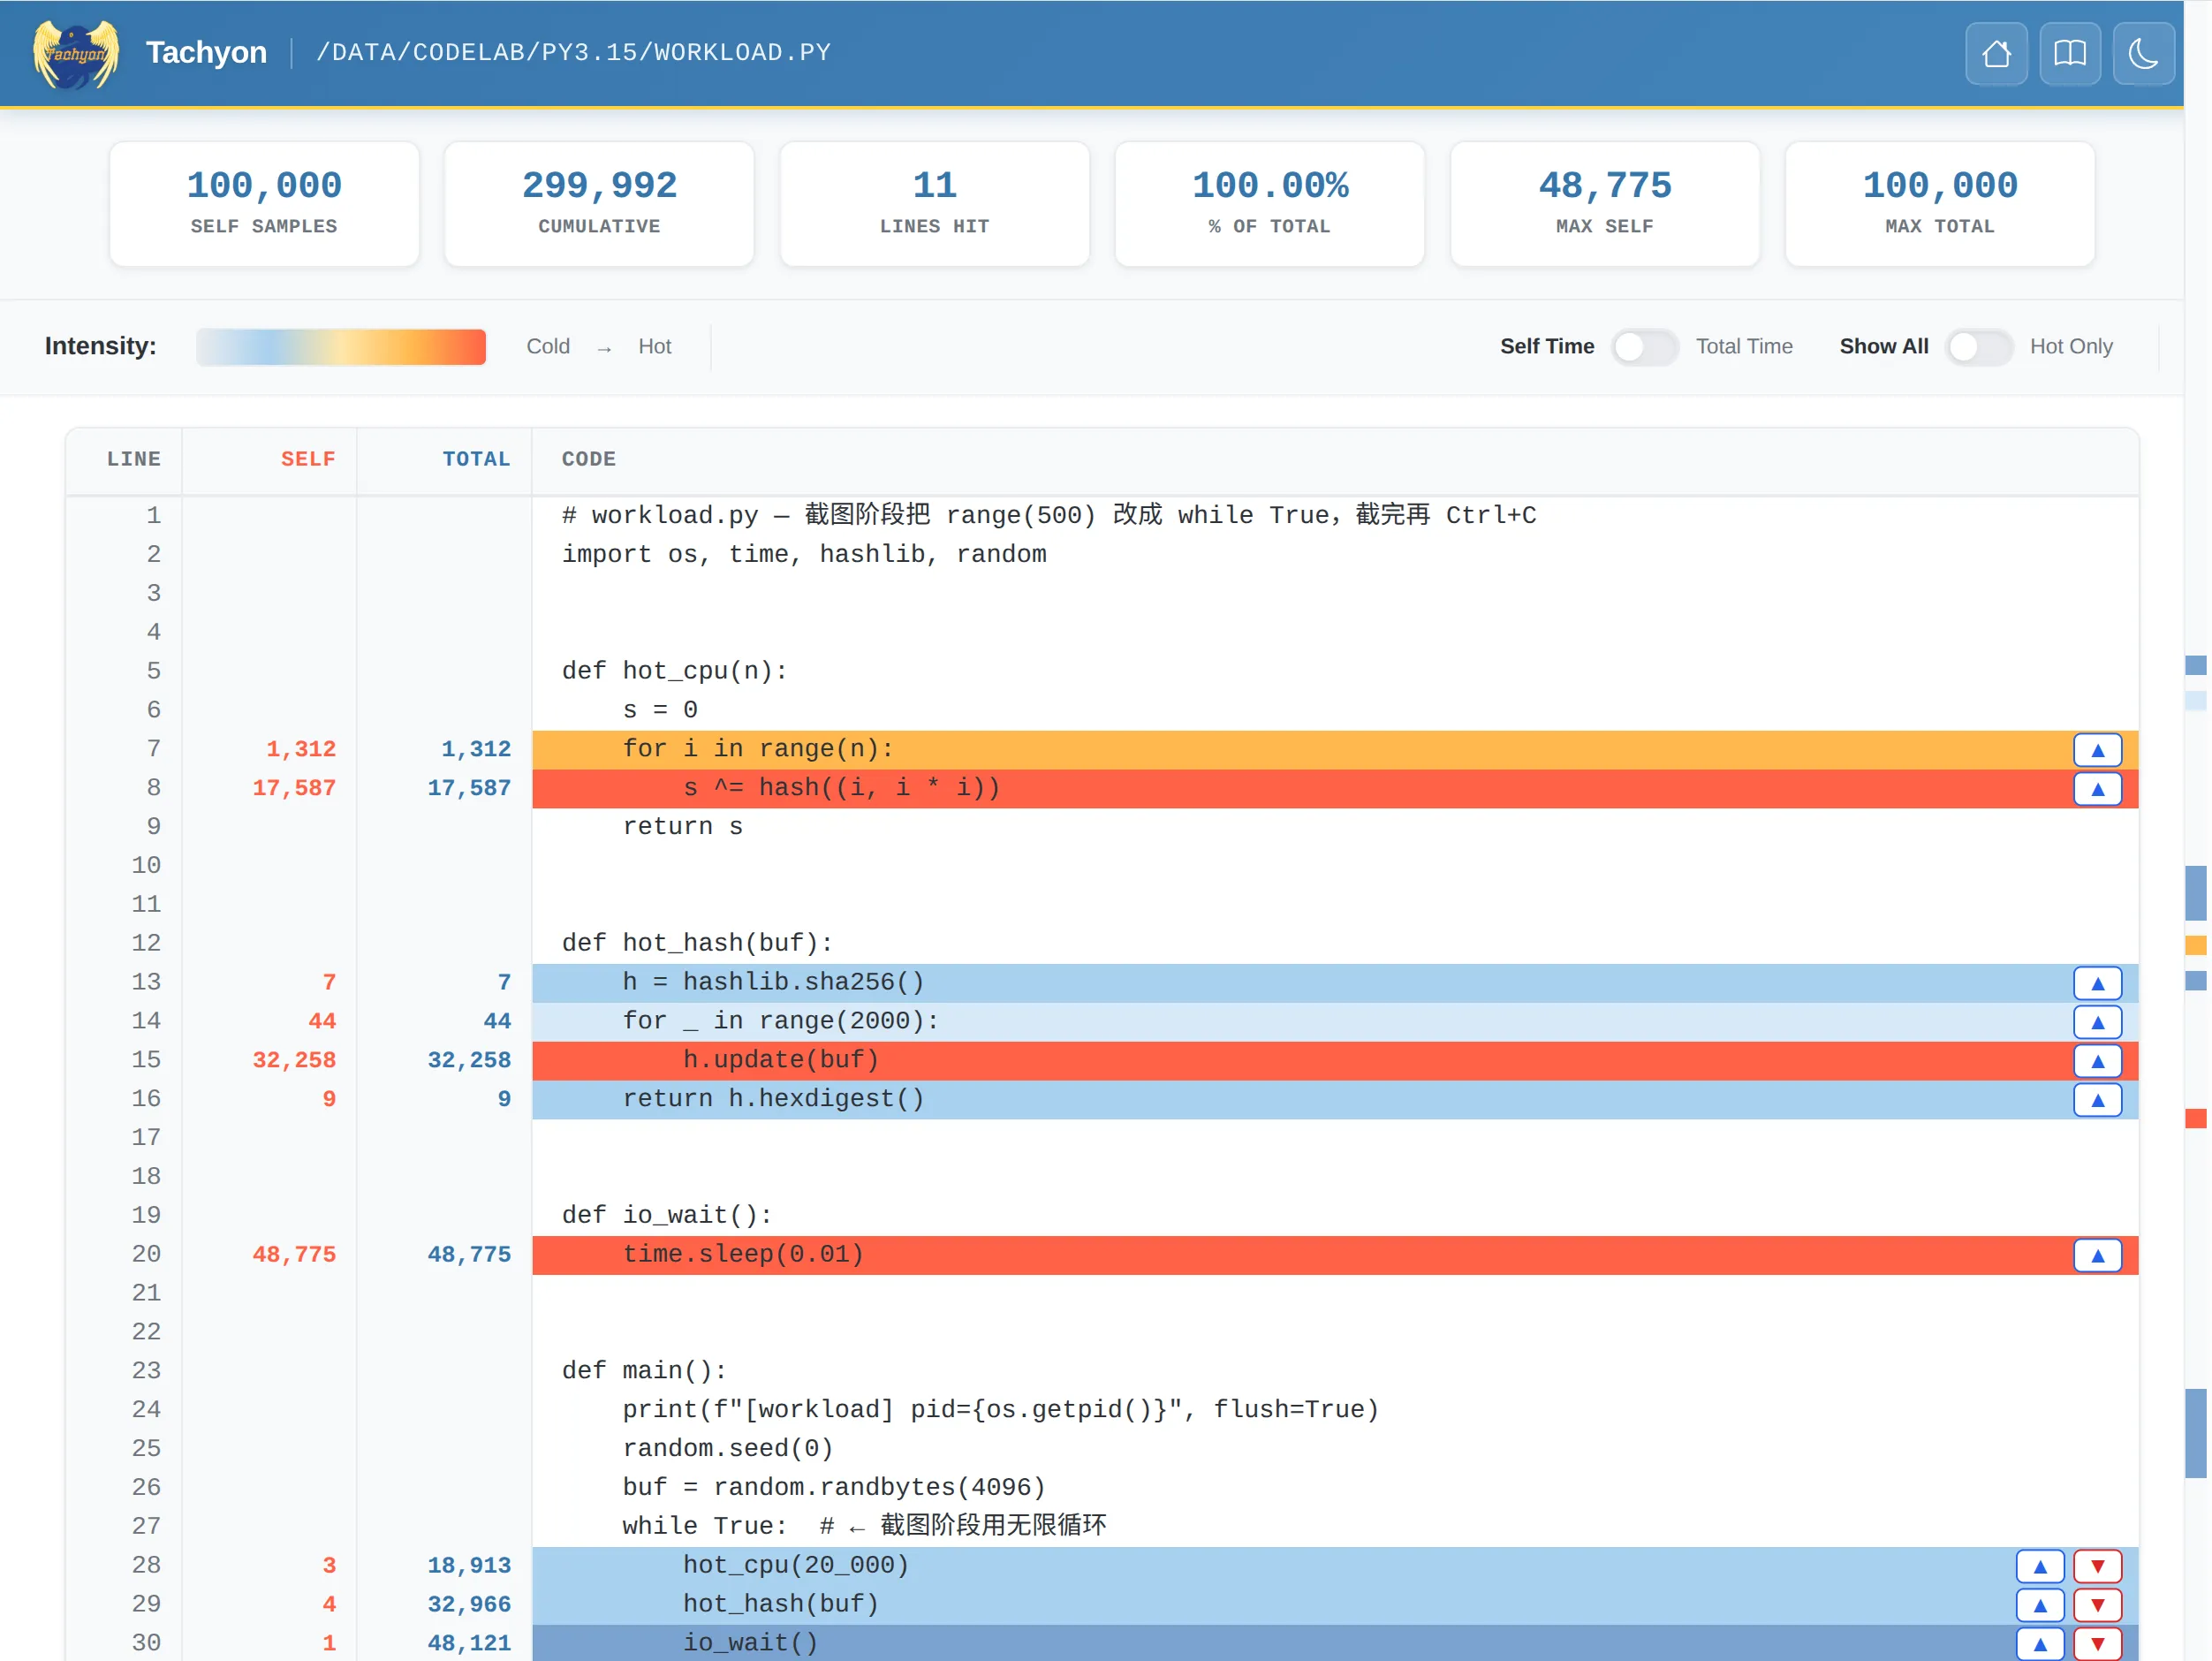
6.4 --heatmap:源码逐行热度
输出一个目录,里面每个被采到的源文件都对应一份 HTML,每行旁边标出”被采到多少次”。注意 -o 这里是目录名(默认 heatmap_<PID>):
$ python -m profiling.sampling attach -d 10 --heatmap -o heat 12345
$ ls heat/
index.html  workload.py.html  hashlib.py.html  ...
最适合 “我知道是这个函数慢,但具体是哪一行” 的二次定位。
6.5 --jsonl:给程序化消费
NDJSON(一行一个 JSON event)。适合自建 dashboard 或者喂给 ClickHouse 做长期趋势:
$ python -m profiling.sampling attach -d 60 --jsonl -o samples.jsonl 12345
$ head -1 samples.jsonl
{"ts": 1750000000.123, "tid": 140123, "stack": ["main", "hot_cpu"], "weight": 1}
6.6 --binary + replay:采一次、多次渲染
这是 Tachyon 工作流上的杀手锏。先用 --binary 把样本以高压缩比的二进制(默认 zstd)存档:
$ python -m profiling.sampling attach -d 30 --binary -o run-001.bin 12345然后用 replay 子命令离线转任意格式 —— 不需要重新采样:
# 转 flamegraph
$ python -m profiling.sampling replay --flamegraph -o run-001.html run-001.bin

# 转 gecko
$ python -m profiling.sampling replay --gecko -o run-001.json run-001.bin

# 转 pstats(默认)打到 stdout
$ python -m profiling.sampling replay run-001.bin | head -20
这件事的实际价值:
- 生产现场只采一次,回到办公室慢慢出图 —— 不用让被测进程被反复 attach。
- 存档比对:把
run-001.bin放到 git/对象存储,半年后某个 issue 复盘还能拉出来重看。 - 节省采样开销:
--binary序列化成本比--flamegraph(要现渲染 HTML)小得多,1 MHz 高频采样推荐先存 binary 再 replay。
6.7 --diff-flamegraph:A/B 对比火焰图
性能优化做完,怎么证明”我这个 PR 真的让 hot_hash 变快了”?传统做法是看两张 flamegraph,肉眼比对。Tachyon 直接出差分火焰图:
# 1. 优化前的 baseline:存成 binary
$ python -m profiling.sampling attach -d 30 --binary -o baseline.bin <PID_OLD>

# 2. 部署优化版,再采一次,直接出差分
$ python -m profiling.sampling attach -d 30 \
    --diff-flamegraph baseline.bin -o diff.html <PID_NEW>
diff.html 里变快的帧染蓝色、变慢的染红色、宽度差表示样本数变化。一眼定位”哪个函数实际变了”。
replay 也能从两个 binary 出差分:
$ python -m profiling.sampling replay --diff-flamegraph baseline.bin -o diff.html new.bin6.8 --live:top 一样的 TUI
--live 不是 output format,而是顶层 TUI 开关 —— 它和 attach/run 都可以搭配,进入交互式实时 profiler:
# attach 到运行中的进程
$ python -m profiling.sampling attach --live 12345
# 或者直接跑一个 script,自带 TUI
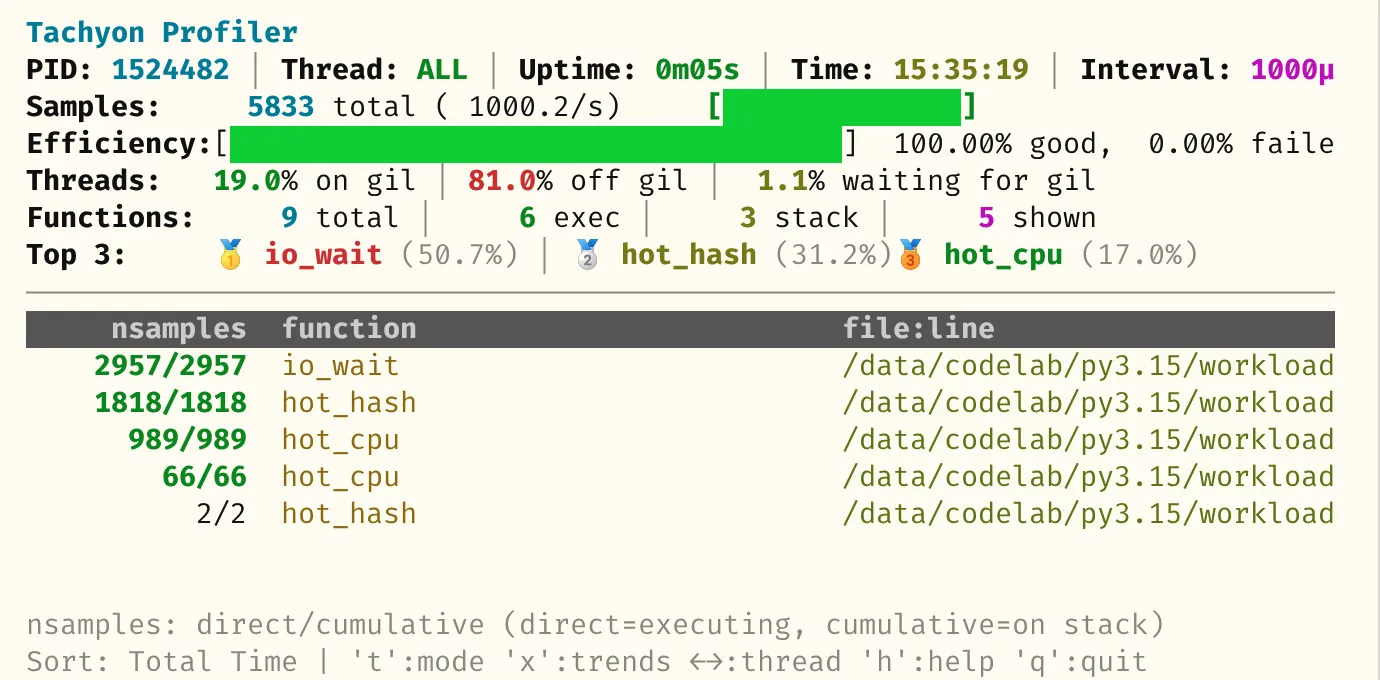
$ python -m profiling.sampling run --live workload.py界面是 top-like 表格:function / nsamples / tottime / cumtime 几列。按 s 循环切换排序,按 q 退出。
7. 高级 flag
下面这些开关日常很少有 profiler 提供,但 Tachyon 都内置了。
7.1 -a / --all-threads:所有线程一起采
默认 Tachyon 只采主线程。如果你跑的是 ThreadPoolExecutor 或者用了多线程做下载,需要加 -a:
$ python -m profiling.sampling attach -a --mode gil --pstats 12345这条命令是”GIL 占用归因”的标准姿势 —— 多线程 + GIL 模式,谁在抢 GIL 一目了然。
7.2 --async-aware:按 task 重建协程栈
普通采样器看 asyncio 程序,栈顶大多是 selector.select,看不出来”哪个 coroutine 正在跑”。Tachyon 顺着 asyncio.Task 的 coroutine chain 把 await 栈重建出来:
$ python -m profiling.sampling attach --async-aware --flamegraph -o flame.html 12345附带 --async-mode:
--async-mode running(默认):只看当前在 CPU 上跑的 task。--async-mode all:把 await 在某个 future 上的 task 一起列出来。
后者在排查”为什么我有 1000 个 task 但 throughput 上不去”时有奇效。
记住:--async-aware 和 --mode 互斥。
7.3 --opcodes:看 adaptive interpreter 的 specialization
Python 3.11 起的 adaptive interpreter(PEP 659)会对 hot bytecode 做 specialization,比如 BINARY_OP 在数值场景下会被换成 BINARY_OP_ADD_INT。3.15 的 Tachyon 暴露了这一层:
$ python -m profiling.sampling attach --opcodes --pstats 12345
...
  LOAD_FAST                   18.4%
  BINARY_OP_ADD_INT           12.1%   <- specialization 命中
  BINARY_OP                    0.3%   <- 没命中的 fallback
  STORE_FAST                   9.7%
  CALL_PY_EXACT_ARGS           6.2%
如果你做过 CPython 性能优化 / 写过 C extension,这是唯一一种能从生产线现场看到 specialization 是否真的命中的方式 —— 平时只能靠 dis 模块猜。
7.4 --native:看到 C 扩展的调用
默认 Tachyon 只展开 Python 帧。加 --native 会在栈里插入 <native> 帧,标记”这一段在非 Python 代码里跑”。对调试 NumPy / Pandas / PyTorch 等 C 扩展深的库非常有用:
$ python -m profiling.sampling attach --native --flamegraph -o flame.html 12345<GC> 帧默认就开,可以看到 GC pause;不想要用 --no-gc。
7.5 --subprocesses:多进程一并采
跑 multiprocessing / Gunicorn workers 时,主进程 attach 上之后加 --subprocesses,每个子进程会独立采样、独立出文件:
$ python -m profiling.sampling attach -d 30 --subprocesses \
    --flamegraph -o flame.html <MASTER_PID>
# 实际产物: flame.pid12345.html, flame.pid12346.html, ...
--browser 配合 --subprocesses 只会给主进程自动开浏览器。
7.6 --blocking:用 ptrace 冻结后再读栈
默认 Tachyon 不冻结目标线程,靠 process_vm_readv 抓快照 —— 读到”半个栈”是有可能的(统计上无碍)。如果你怀疑某次 dump 不一致,可以加 --blocking:Linux 用 ptrace、macOS 用 thread_suspend,先停目标再读:
$ python -m profiling.sampling dump --blocking 12345代价是会让被测进程短暂卡顿,慎用于生产高 QPS 服务。
8. 完整实战:一个真实的优化 loop
把上面的 workload.py 走完整流程,用 binary + replay 工作流:
# 1) 起 workload
$ python workload.py
[workload] pid=12345

# 2) 采一份 baseline binary(30 秒、1 MHz、所有线程)
$ python -m profiling.sampling attach -d 30 -r 1mhz -a \
    --binary -o baseline.bin 12345

# 3) replay 出 pstats 找瓶颈
$ python -m profiling.sampling replay --pstats --sort tottime -l 10 baseline.bin
# -> 看到 hot_hash 的 self time 占大头

# 4) replay 出 heatmap 定位到具体行
$ python -m profiling.sampling replay --heatmap -o heat baseline.bin
# -> 打开 heat/workload.py.html,看到 for _ in range(2000) 那行最热

# 5) 改代码:h.update(buf * 2000) 替换原来的循环、部署、新 PID = 67890

# 6) 采新版 + 直接出差分火焰图
$ python -m profiling.sampling attach -d 30 -r 1mhz -a \
    --diff-flamegraph baseline.bin -o diff.html 67890
# -> diff.html 里 hot_hash 那一帧应该明显变蓝(变快)整套流程不需要重启被测进程任何一次(第 5 步部署新版那一次除外)。这是和 cProfile 工作流最大的差别 —— 你可以在生产环境一边接流量一边分析。
9. 和现有工具的对比
| 工具 | 类型 | 能 attach | 标准库 | wall / cpu / gil / exception | async aware | opcode aware | A/B 差分 |
|---|---|---|---|---|---|---|---|
cProfile (tracing) | tracing | 否 | 是 | wall(带巨大开销) | 否 | 否 | 否 |
py-spy | sampling | 是 | 否 | wall / cpu | 部分 | 否 | 否 |
Scalene | sampling + perf | 是(部分) | 否 | cpu + memory + GPU | 部分 | 否 | 否 |
austin | sampling | 是 | 否 | wall / cpu | 是 | 否 | 否 |
| Tachyon (3.15) | sampling | 是 | 是 | 四种全有 | 是 | 是 | 是(--diff-flamegraph) |
短评:
- 如果你需要 memory profiling,目前还得用 Scalene 或 memray —— Tachyon 不覆盖。
- 如果你的限制是”只能用标准库”(如某些受控生产环境、Docker base image 极简化),Tachyon 是 3.15 之后唯一能 attach 的选项。
- 在标准 wall/cpu 场景下,Tachyon 和 py-spy 体感接近;但 GIL / exception / opcodes / 差分火焰图 / binary+replay 这五个维度独此一家。
10. 一些注意事项
- 权限:attach 模式在 Linux 上需要
CAP_SYS_PTRACE(或同 uid)。在容器里要么--cap-add=SYS_PTRACE,要么共享 namespace。 - 被测进程版本:attach 模式要求被测进程也是 3.15+(旧版本进程的 frame layout Tachyon 不认)。
run模式没这个问题。 - TSC / 时间源:Tachyon 内部用
CLOCK_MONOTONIC,所以采样精度跟你机器的 vDSO/clocksource 配置 直接相关。在虚拟机里如果 clocksource 还在 HPET,会显著拖慢采样上限。 -r 1mhz是上限、不是日常:常用值1khz–10khz就够看趋势了;1 MHz 主要用来追极短 critical section。--mode和--async-aware互斥:要看 await 链就别开 mode,要测 wall/cpu/gil/exception 就别开 async-aware。- PID 永远是位置参数、永远放最后:3.15.0 的 argparse 比较挑,
attach --flamegraph 12345 -d 10这种顺序会报 unrecognized arguments。
11. 小结
Tachyon 把”生产环境零开销 attach 采样”这件事写进了标准库,外加四种 mode × 八种输出 + TUI 的组合空间,再加 --binary + replay + --diff-flamegraph 的存档式工作流。从 Python 3.15 开始:
- 默认抓现场:
python -m profiling.sampling attach -d 30 -r 1mhz -a --binary -o snap.bin <PID> - 现场出火焰图:
python -m profiling.sampling replay --flamegraph -o snap.html snap.bin - 优化后对比:
python -m profiling.sampling attach -d 30 --diff-flamegraph snap.bin -o diff.html <PID_NEW> cProfile留给”我只是想看一个本地脚本的函数耗时表”。profile(纯 Python 版)这次真的可以删了,3.17 会从标准库里消失。
Contributed by Pablo Galindo and László Kiss Kollár(gh-135953、gh-138122)。PEP 文本:PEP 799。